

When your child’s ISEE score report arrives, it can feel like a lot of numbers at once. Scaled scores, percentile ranks, stanines, stanine analysis — it’s more information than most families are used to seeing from a single test, and it doesn’t always come with a clear explanation of what any of it means.
This guide walks through each part of the report so you can read it with confidence and understand what the numbers are actually telling you.
The Four Parts of an ISEE Score Report
According to the ERB, ISEE scores are reported in four ways: scaled scores, percentile ranks, stanines, and stanine analysis. Each one gives a slightly different view of your child’s performance, and they work together to tell a fuller story than any single number can on its own.
Scaled Scores
The scaled score is the starting point. It’s calculated based on the number of questions your child answered correctly, adjusted for minor differences in difficulty between different versions of the test. Because the ISEE is revised regularly, a scaled score is designed to mean the same thing regardless of which version of the test your child took. This adjustment is what makes it possible to compare results across different test dates.
One important note: the ISEE has no wrong-answer penalty. Every question your child answered correctly contributes to their scaled score, and unanswered questions don’t count against them either way. This is worth keeping in mind when reviewing the report alongside their test-taking habits.
Percentile Ranks
The percentile rank is where many parents first feel confused, and the most common misconception is worth clearing up right away. A percentile rank does not tell you what percentage of questions your child answered correctly. It tells you how your child’s score compares to other students who took the ISEE.
As ERB explains, a percentile rank of 65 in a given section means your child scored as well as or better than 65% of students in the norm group for that section. The norm group is made up of all students in the same grade who took the ISEE over the past three years.
That norm group is an important context. The students your child is being compared to aren’t a general cross-section of the population; they’re students who took the ISEE. This means they’re applying to independent schools, indicating a self-selected, academically motivated group. A percentile rank that might feel middling on a different test can represent genuinely strong performance on the ISEE, because the comparison group is more competitive than average.
Stanines
A stanine condenses the percentile range into a nine-point scale. Here’s how the mapping works, directly from ERB’s official score report documentation:
| Stanine | Percentile Range |
| 9 | 96–99 |
| 8 | 89–95 |
| 7 | 77–88 |
| 6 | 60–76 |
| 5 | 40–59 |
| 4 | 23–39 |
| 3 | 11–22 |
| 2 | 4–10 |
| 1 | 1–3 |
Stanines group students into broader bands rather than precise rankings. This is intentional: it discourages over-interpreting small differences between scores. A student with a percentile rank of 62 and a student with a percentile rank of 74 are both in stanine 6. The stanine framework is a reminder that a few points’ difference in a percentile rank doesn’t necessarily represent a meaningful difference in performance.
Stanine Analysis
The stanine analysis section of the report breaks down performance within each content area in more detail, giving schools a richer picture of a student’s strengths and areas for growth across verbal reasoning, quantitative reasoning, reading comprehension, and mathematics achievement. This section is particularly useful for identifying which areas highlighted the most room to grow, and is something worth discussing with your child’s tutor if you have one.
Related: What Makes Flashcards Actually Work for Vocabulary Retention

Sections Covered
The ISEE score report includes results for four scored sections: Verbal Reasoning, Quantitative Reasoning, Reading Comprehension, and Mathematics Achievement. The essay is also included in the report sent to schools, but it’s not scored. Schools read it as part of the full application picture, but it doesn’t produce a number.
Who Sees the Report
Families have control over who receives the score report. You can designate which schools receive it when you register for the test, or after you’ve reviewed the scores. Importantly, ERB confirms that families can choose whether or not to share their score reports with applicant schools. If a sitting doesn’t go the way your child hoped, it’s worth knowing that sharing is a choice, not a default.
Related: How to Help Your Child Feel Confident on ISEE Test Day
Watermelon Math: Surprisingly Sweet Test Prep.™

42 full-color math concept cards for ISEE prep
$23.95
Shop Now16 Timed Sets for the Lower Level ISEE
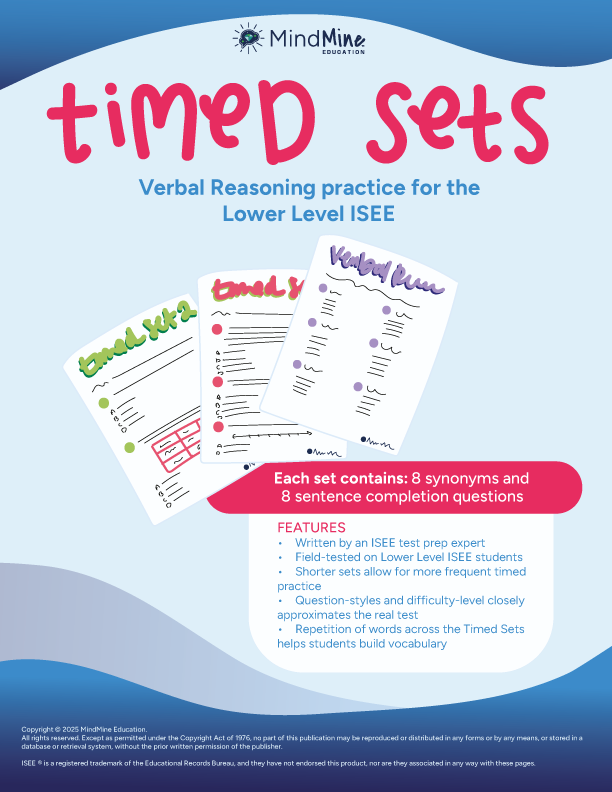
Verbal Reasoning practice sets with real test pacing
$12.50
Shop NowLower Level ISEE Verbal Reasoning Practice

Standalone practice section download
$5.00
Shop NowHow Schools Use the Scores
This is one of the most important things to understand: schools make their own decisions about how to interpret and use ISEE scores, and those policies vary. Some schools look most closely at stanines; others weigh certain sections more heavily; there are those who consider the highest score across multiple sittings; and some look at all sittings together.
ERB’s guidelines note that recent research supports the practice of “super scoring,” which means taking the best section score across multiple test dates, but individual schools set their own policies. It’s worth checking with each school’s admissions office directly to understand what they’re looking at.
Related: What Parents Should Know Before Their Child Takes the SSAT

Reading the Report With the Right Expectations
One thing that catches families off guard is seeing percentile ranks that feel lower than expected, even when their child prepared carefully. That’s not a reflection of poor preparation. It’s a reflection of who’s in the norm group. Comparing your child’s ISEE percentile to their performance on school tests or other standardized tests isn’t a useful comparison. The context and the comparison groups are different. Setting expectations before the report arrives is often more useful than interpreting them after. For families in New York, our guide to Tribeca ISEE test prep covers how to set a realistic target against your child’s starting point and school list rather than against a perfect score.
The most useful way to read an ISEE score report is section by section, looking for patterns rather than fixating on any single number. Where did your child feel most confident? Where did pacing or content gaps show up? What does the stanine analysis reveal about specific skill areas?
At MindMine Education, reviewing score reports is part of the tutoring process, and helping families understand what the numbers mean in context is something Kelly does with every family she works with. If your child is preparing for the ISEE and you’d like to start with a clear baseline picture, the ISEE Readiness Audit is a good first step. If you have questions about a score report you’ve already received, reach out and we can talk through it together.
References:
- Educational Records Bureau. ISEE Score Reports for Families. erblearn.org. https://www.erblearn.org/families/isee-by-erb/score-reports/
- Educational Records Bureau. Understanding the ISEE Score Report (PDF). erblearn.org. https://www.erblearn.org/wp-content/uploads/documents/isee/ERB_ISEE_Understanding_Score_Reports.pdf
Related:
- What Makes Flashcards Actually Work for Vocabulary Retention
- How to Help Your Child Feel Confident on ISEE Test Day
- What Parents Should Know Before Their Child Takes the SSAT
